Computing the evolution of mechanical systems is just the beginning of understanding the dynamics. Typically, we want to know much more than the phase space evolution of some particular trajectory. We want to obtain a qualitative understanding of the motion. We want to know what sorts of motion are possible, and how one type relates to others. We want to abstract the essential dynamics from the myriad particular evolutions that we can calculate. Paradoxically, it turns out that by throwing away most of the calculated information about a trajectory we gain essential new information about the character of the trajectory and its relation to other trajectories.
A remarkable tool that extracts the essence by throwing away information is a technique called the surface of section or Poincaré section.22 A surface of section is generated by looking at successive intersections of a trajectory or a set of trajectories with a plane in the phase space. Typically, the plane is spanned by a coordinate axis and the canonically conjugate momentum axis. We will see that surfaces of section made in this way have nice properties.
The surface of section technique was put to spectacular use in the 1964 landmark paper [22] by astronomers Michel Hénon and Carl Heiles. In their numerical investigations they found that some trajectories are chaotic, whereas other trajectories are regular. An essential characteristic of the chaotic motions is that initially nearby trajectories separate exponentially with time; the separation of regular trajectories is linear.23 They found that these two types of trajectories are typically clustered in the phase space into regions of regular motion and regions of chaotic motion.
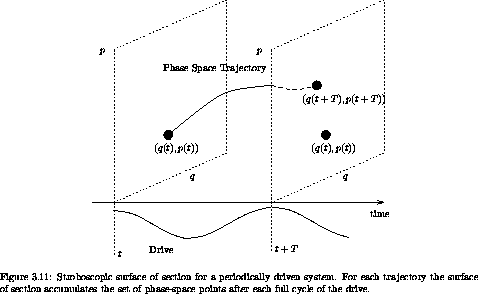
For a periodically driven system the surface of section is a stroboscopic view of the evolution; we consider only the state of the system at the strobe times, with the period of the strobe equal to the drive period. We generate a surface of section for a periodically driven system by computing a number of trajectories and accumulating the phase-space coordinates of each trajectory whenever the drive passes through some particular phase. Let T be the period of the drive; then, for each trajectory, the surface of section accumulates the phase-space points ( q(t), p(t) ), ( q(t + T), p(t + T) ), ( q(t + 2T), p(t + 2T) ), and so on (see figure 3.11). For a system with a single degree of freedom we can plot the sequence of phase-space points on a q, p surface.

In the case of the stroboscopic section for the periodically driven system, the phase of the drive is the same for all section points; thus each phase-space point in the section, with the known phase of the drive, may be considered as an initial condition for the rest of the trajectory. The absolute time of the particular section point does not affect the subsequent evolution; all that matters is that the phase of the drive have the value specified for the section. Thus we can think of the dynamical evolution as generating a map that takes a point in the phase space and generates a new point on the phase space after evolving the system for one drive period. This map of the phase space onto itself is called the Poincaré map.
Figure 3.12 shows an example Poincaré section for the driven pendulum. We plot the section points for a number of different initial conditions. We are immediately presented with a new facet of dynamical systems. For some initial conditions, the subsequent section points appear to fill out a set of curves in the section. For other initial conditions this is not the case: rather, the set of section points appear scattered over a region of the section. In fact, all of the scattered points in figure 3.12 were generated from a single initial condition. The surface of section suggests that there are qualitatively different classes of trajectories distinguished by the dimension of the subspace of the section that they explore.
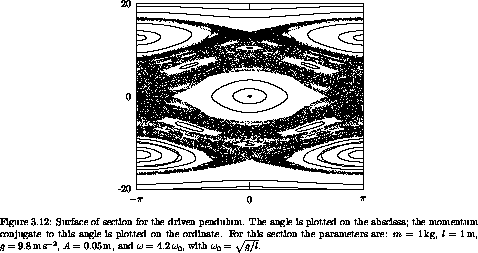
Trajectories that fill out curves on the surface of section are called regular or quasiperiodic trajectories. The curves that are filled out by the regular trajectories are invariant curves. They are invariant in that if any section point for a trajectory falls on an invariant curve, all subsequent points fall on the same invariant curve. Otherwise stated, the Poincaré map maps every point on an invariant curve onto the invariant curve.
The trajectories that appear to fill areas are called chaotic trajectories. For these points the distance in phase space between initially nearby points grows, on average, exponentially with time.24 In contrast, for the regular trajectories, the distance in phase space between initially nearby points grows, on average, linearly with time.
The phase space seems to be grossly clumped into different regions. Initial conditions in some regions appear to predominantly yield regular trajectories, and other regions appear to predominantly yield chaotic trajectories. This gross division of the phase space into qualitatively different types of trajectories is called the divided phase space. We will see later that there is much more structure here than is apparent at this scale, and that upon magnification there is a complicated interweaving of chaotic and regular regions on finer and finer scales. Indeed, we shall see that many trajectories that appear to generate curves on the surface of section are, upon magnification, actually chaotic and fill a tiny area. We shall also find that there are trajectories that lie on one-dimensional curves on the surface of section, but only explore a subset of this curve formed by cutting out an infinite number of holes.25
The features seen on the surface of section of the driven pendulum are quite general. The same phenomena are seen in most dynamical systems. In general, there are both regular and chaotic trajectories, and there is the clumping characteristic of the divided phase space. The specific details depend upon the system, but the basic phenomena are generic. Of course, we are interested in both aspects: the phenomena that are common to all systems, and the specific details for particular systems of interest.
The surface of section for the periodically driven pendulum has specific features that give us qualitative information about how this system behaves. The central island in figure 3.12 is the remnant of the oscillation region for the unforced pendulum (see figure 3.4 in section 3.3). There is a sizable region of regular trajectories here that are, in a sense, similar to the trajectories of the unforced pendulum. In this region, the pendulum oscillates back and forth, much as the undriven pendulum does, but the drive makes it wiggle as it does so. The section points are all collected at the same phase of the drive so we do not see these wiggles on the section.
The central island is surrounded by a large chaotic zone. Thus the region of phase space with regular trajectories similar to the unforced trajectories has finite extent. On the section, the boundary of this ``stable'' region is apparently rather well defined -- there is a sudden transition from smooth regular invariant curves to chaotic motion that can take the system far from this region of regular motion.
There are two other sizeable regions of regular behavior. The trajectories in these regions are resonant with the drive, on average executing one full rotation per cycle of the drive. The two islands differ in the direction of the rotation. In these regions the pendulum is making complete rotations, but the rotation is locked to the drive so that points on the section appear only in the islands with finite angular extent. The fact that points for particular trajectories loop around the islands means that the pendulum sometimes completes a cycle faster than the drive and sometimes slower than the drive, but never loses lock.
Each regular region has finite extent. So from the surface of section we can see directly the range of initial conditions that remain in resonance with the drive. Outside of the regular region initial conditions lead to chaotic trajectories that evolve far from the resonant regions.
Various higher-order resonance islands are also visible, as are nonresonant regular circulating orbits. So, the surface of section has provided us with an overview of the main types of motion that are possible and their interrelationship.
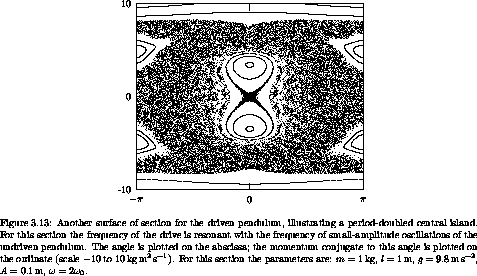
Changing the parameters shows other interesting phenomena. Figure 3.13 shows the surface of section when the drive frequency is twice the natural small-amplitude oscillation frequency of the undriven pendulum. The section has a large chaotic zone, with an interesting set of islands. The central equilibrium has undergone an instability and instead of a central island we find two off-center islands. These islands are alternately visited one after the other. As the support goes up and down the pendulum alternately tips to one side and then the other. It takes two periods of the drive before the pendulum visits the same island. Thus, the system has ``period-doubled.'' An island has been replaced by a period-doubled pair of islands. Note that other islands still exist. The islands in the top and bottom of the chaotic zone are the resonant islands, in which the pendulum loops on average a full turn for every cycle of the drive. Note that, as before, if the pendulum is rapidly circulating, the motion is regular.
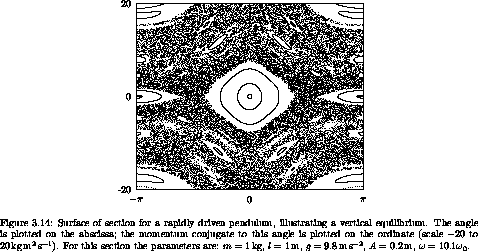
It is a surprising fact that if we shake the support of a pendulum fast enough then the pendulum can stand upright. This phenomenon can be visualized with the surface of section. Figure 3.14 shows a surface of section when the drive frequency is large compared to the natural frequency. The pendulum can stand upright because there is a regular island at the inverted equilibrium. The surface of section shows that the pendulum can remain upright for a range of initial displacements from the vertical.
We already have the system derivative for the pendulum, and we can use it to make a parametric map for constructing Poincaré sections:
(define (driven-pendulum-map m l g A omega)
(let ((advance (state-advancer H-pend-sysder m l g A omega))
(map-period (/ :2pi omega)))
(lambda (theta ptheta return fail)
(let ((ns (advance
(up 0 theta ptheta) ; initial state
map-period))) ; integration interval
(return ((principal-value :pi) (coordinate ns))
(momentum ns))))))
A map procedure takes the two section coordinates (here theta and ptheta) and two ``continuation'' procedures. If the section coordinates given are in the domain of the map, it produces two new section coordinates and passes them to the return continuation, otherwise the map procedure calls the fail continuation procedure with no arguments.26
The trajectories of a map can be explored with an ``interactive'' interface. The procedure explore-map lets us use a pointing device to choose initial conditions for trajectories. For example, the surface of section in figure 3.12 was generated by plotting a number of trajectories, using a pointer to choose initial conditions, with the following program:
(define win (frame :-pi :pi -20 20))
(let ((m 1.0) ;m=1kg
(l 1.0) ;l=1m
(g 9.8) ;g=9.8m/s2
(A 0.05)) ;A=1/20m
(let ((omega0 (sqrt (/ g l))))
(let ((omega (* 4.2 omega0)))
(explore-map
win
(driven-pendulum-map m l g A omega)
1000)))) ;1000 points for each ic
Exercise 3.10. Fun with phase portraits
Choose some one-degree-of-freedom dynamical system that you are
curious about and that can be driven with a periodic drive. Construct
a map of the sort we made for the driven pendulum and do some
exploring. Are there chaotic regions? Are all of the chaotic regions
connected together?
We illustrated the use of Poincaré sections to visualize qualitative features of the phase space for a one degree-of-freedom system with periodic drive, but the idea is more general. Here we show how Hénon and Heiles [22] used the surface of section to elucidate the properties of an autonomous system.
In the early '60s astronomers were up against a wall. Careful
measurements of the motion of nearby stars in the galaxy had allowed
particular statistical averages of the observed motions to be
determined, and the averages were not at all what was expected. In
particular, what was calculated was the velocity dispersion: the root
mean square deviation of the velocity from the average. We use angle
brackets to denote an average over nearby stars: < w >
is the average value of some quantity w for the stars in the
ensemble. The average velocity is <  >. The
components of the velocity dispersion are

If we use cylindrical polar coordinates (r,  , z) and align the
axes with the galaxy so that z is perpendicular to the galactic
plane and r increases with the distance to the center of the galaxy,
then two particular components of the velocity dispersion are

It was expected at the time that these two components of the
velocity dispersion should be equal. In fact they were found to
differ by about a factor of 2:  r approx 2
 z. What was the problem? In the literature at the time
there was considerable discussion of what could be wrong. Was the
problem some observational selection effect? Were the velocities
measured incorrectly? Were the assumptions used in the derivation of
the expected ratio not adequately satisfied? For example, the
derivation assumed that the galaxy was approximately axisymmetric.
Perhaps non-axisymmetric components of the galactic potential were at
fault. It turned out that the problem was much deeper. The
understanding of motion was wrong.
Let's review the derivation of the expected relation among the
components of the velocity dispersion. We wish to give a statistical
description of the distribution of stars in the galaxy. We introduce
the phase-space distribution function f( ,
,  ), which
gives the probability density of finding a star at position
  with momentum
  .27
Integrating this density over some finite
volume of phase space gives the probability of finding a star in that
phase-space volume (in that region of space within a specified region
of momenta). We assume the probability density is normalized so that
the integral over all of phase space gives unit probability; the star
is somewhere and has some momentum with certainty. In terms of f,
the statistical average of any dynamical quantity w over some volume
of phase space V is just

where the integral extends over the phase-space volume V. In
computing the velocity dispersion at some point  , we would
compute the averages by integrating over all momenta.
Individual stars move in the gravitational potential of the rest of the galaxy. It is not unreasonable to assume that the overall distribution of stars in the galaxy does not change much with time, or changes only very slowly. The density of stars in the galaxy is actually very small and close encounters of stars are very rare. Thus, we can model the gravitational potential of the galaxy as a fixed external potential in which individual stars move. The galaxy is approximately axisymmetric. We assume that the deviation from exact axisymmetry is not a significant effect and thus we take the model potential to be exactly axisymmetric.
Consider the motion of a point mass (a star) in an axisymmetric potential (of the galaxy). In cylindrical polar coordinates the Hamiltonian is

where V does not depend on  . Since
  does not
appear, we know that the conjugate momentum
p
 is constant.
For the motion of any particular star we can treat p
 as a
parameter. Thus the effective Hamiltonian has two degrees of freedom:


The value E of the Hamiltonian is constant since there is no
explicit time dependence in the Hamiltonian. Thus, we have constants
of the motion E and p .
.
Jeans's ``theorem'' asserts that the distribution function f depends only on the values of the integrals of motion. That is, we can introduce a different distribution function f' that represents the same physical distribution:

At the time, there was good reason to believe that this might be correct. First,
it is clear that the distribution function surely depends at least on
E and p . The problem is, ``Given an energy E and angular
momentum p
 , what motion is allowed?''
The integrals clearly confine the evolution.
Does the evolution carry the system everywhere in the phase space
subject to these known constraints? In the early part of the
20th century this appeared plausible. Statistical mechanics was
successful, and statistical mechanics made exactly this assumption.
Perhaps there are other integrals of the motion that exist, but that we
have not yet discovered? Poincaré proved an important theorem
with regard to integrals of the motion.
Poincaré proved that most integrals of
a dynamical system typically do not persist upon perturbation of
the system. That is, if a small perturbation is added to a problem,
then most of the integrals of the original problem do not have analogs in the
perturbed problem. The integrals are destroyed. Of course, integrals
that result from symmetries of the problem continue to be preserved
if the perturbed system has the same symmetries. Thus angular
momentum continues to be preserved upon application of any
axisymmetric perturbation. Poincaré's theorem is correct, but what
came next was not. As a corollary to Poincaré's theorem, in 1920
Fermi published a
proof of an ergodic theorem stating that
typically the motion of perturbed problems is ergodic28
subject to the
constraints imposed by the integrals resulting from symmetries.
Loosely speaking, this means that
trajectories go everywhere they are allowed to go by
the integral constraints. Fermi's theorem was later shown to be
incorrect, but on the basis of this theorem we could expect that
typically systems fully explore the phase space, subject only to the
constraints imposed by the integrals resulting from symmetries.
Suppose then that the evolution of stars in the galactic potential
is subject only to the constraints of conserving E and p
 .
We shall see that this is not true, but if it were we could then
conclude that the distribution function for stars in the galaxy can
also depend only on E and p
 .
.
Given this form of the distribution function, we can deduce the stated ratios of the velocity dispersions. We note that pz and pr appear in the same way in the energy. Thus the average of any function of pz computed with the distribution function must equal the average of the same function of pr. In particular, the velocity dispersions in the z and r directions must be equal:

But this is not what was observed, which was

Hénon and Heiles [22] approached this problem differently from others at the time. Rather than improving the models for the motion of stars in the galaxy, they concentrated on what turned out to be the central issue: What is the qualitative nature of motion? The problem had nothing to do with galactic dynamics in particular, but with the problem of motion. They abstracted the dynamical problem from the particulars of galactic dynamics.
We have seen that the study of the motion of a point with mass m and an axisymmetric potential energy reduces to the study of a reduced two-degree-of-freedom problem in r and z with potential energy U(r, z). Hénon and Heiles chose to study the motion in a two-degree-of-freedom system with a particularly simple potential energy so the dynamics would be clear and the calculation uncluttered. The Hénon-Heiles Hamiltonian is


The potential energy is shaped like a distorted bowl. It has triangular symmetry, as is evident when it is rewritten in polar coordinates:

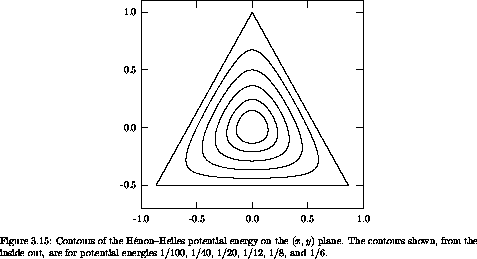
Contours of the potential energy are shown in figure 3.15. At small values of the potential energy the contours are approximately circular; as the value of the potential energy approaches 1/6 the contours become triangular, and at larger potential energies the contours open to infinity.
The Hamiltonian is independent of time, so energy is conserved. In this case this is the only known integral. We first determine the restrictions that conservation of energy imposes on the evolution. We have

so the motion is confined to the region inside the contour V = E because the sum of the squares of the momenta cannot be negative.
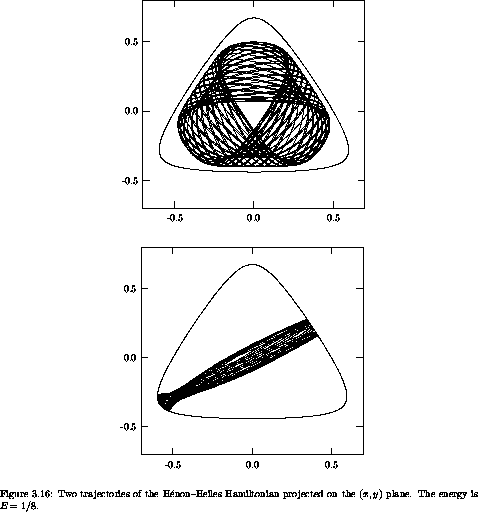
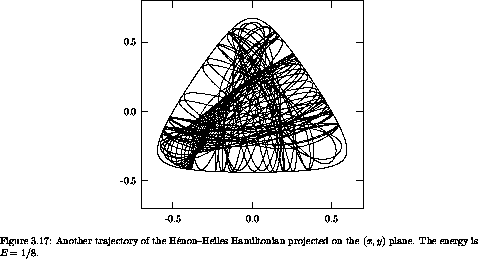
Let's compute some sample trajectories. For definiteness, we investigate trajectories with energy E = 1/8. There are a large variety of trajectories. There are trajectories that circulate in a regular way around the bowl, and there are trajectories that oscillate back and forth (figure 3.16). There are also trajectories that appear more irregular (figure 3.17). There is no end to the trajectories that could be computed, but let's face it, surely there is more to life than looking at trajectories.
The problem facing Hénon and Heiles was the issue of integrals of motion. Are there other integrals besides the obvious ones? They investigated this issue with the surface of section technique. The surface of section is generated by looking at successive passages of trajectories through a plane in phase space. How does this address the issue of the number of integrals? A priori, there appear to be two possibilities: either there are hidden integrals or there are not. Suppose there is no other integral of the motion besides the energy. Then the expectation was that successive intersections of the trajectory with the section plane would eventually explore all of the section plane that is consistent with conservation of energy. On the other hand, if there is a hidden integral then the successive intersections would be constrained to fall on a curve.

Specifically, the surface of section is generated by recording and plotting py versus y whenever x = 0, as shown in figure 3.18. Given the value of the energy E and a point ( y, py ) on the section x = 0, we can recover px, up to a sign. If we restrict attention to intersections with the section plane that cross with, say, positive px, then there is a one-to-one relation between section points and trajectories. A section point thus corresponds to a unique trajectory.

Because px2 is positive, the trajectory is confined by the energy integral to regions of the section such that

So, if there is no other integral, we might expect the points on the section eventually to fill the area enclosed by this bounding curve.
On the other hand, suppose there is a hidden extra integral I(x, y; px, py) = 0. Then this integral would provide further constraints on the trajectories and their intersections with the section plane. An extra integral I provides a constraint among the four phase-space variables x, y, px, and py. We can use E to solve for px, so for a given E the integral I gives a relation among x, y, and py. Using the fact that on the section x = 0, the integral gives a relation between y and py on the section for a given E. So we expect that if there is another integral the successive intersections of a trajectory with the section plane will fall on a curve.
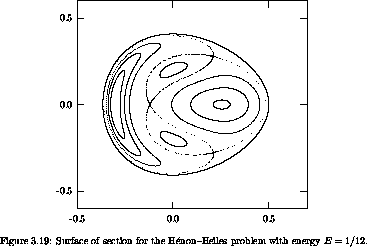
If there is no extra integral we expect the section points to fill an area; if there is an extra integral we expect the section points to be restricted to a curve. What actually happens? Figure 3.19 shows a surface of section for E = 1/12; the section points for several representative trajectories are displayed. By and large, the points appear to be restricted to curves, so there appears to be evidence for an extra integral. Look closely though. Where the ``curves'' cross, the lines are a little fuzzy. Hmmm.
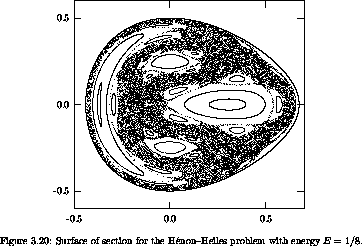
Let's try a little larger energy, E = 1/8. The appearance of the section changes qualitatively (figure 3.20). For some trajectories there still appear to be extra constraints on the motion. But other trajectories appear to fill an area of the section plane, pretty much as we expected of trajectories if there was no extra integral. In particular, all of the scattered points on this section were generated by a single trajectory. Thus, some trajectories behave as if there is an extra integral, and others don't. Wow!
Let's go on to a higher energy, E = 1/6, just at the escape energy. A section for this energy is shown in figure 3.21. Now, a single trajectory explores most of the region of the section plane allowed by energy conservation, but not entirely. There are still trajectories that appear to be subject to extra constraints.
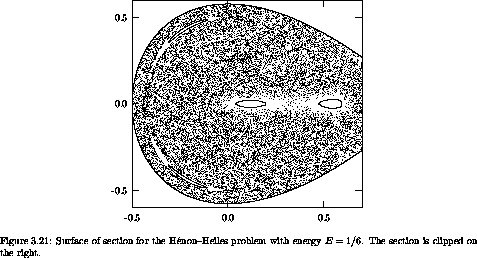
We seem to have all possible worlds. At low energy, the system by and large behaves as if there is an extra integral, but not entirely. At intermediate energy, the phase space is divided: some trajectories explore areas whereas others are constrained. At high energy, trajectories explore most of the energy surface; few trajectories show extra constraints. We have just witnessed our first transition to chaos.
Two qualitatively different types of motion are revealed by this surface of section, just as we saw in the Poincaré sections for the driven pendulum. There are trajectories that seem to be constrained as if by an extra integral. And there are trajectories that explore an area on the section as though there were no extra integrals. Regular trajectories appear to be constrained by an extra integral to a one-dimensional set on the section; chaotic trajectories are not constrained in this way and explore an area.29
The surface of section not only reveals the existence of qualitatively different types of motion, but also provides an overview of the different types of trajectories. Take the surface of section for E = 1/8 (figure 3.20). There are four main islands, engulfed in a chaotic sea. The particular trajectories displayed above provide examples from different parts of the section. The trajectory that loops around the bowl (figure 3.16) belongs to the large island on the left side of the section. Similar trajectories that loop around the bowl in the other direction belong to the large island on the right side of the section. The trajectories that oscillate back and forth across the bowl belong to the two islands above and below the center of the section. (By symmetry there should be three such islands. The third island is snugly wrapped against the boundary of the section.) Each of the main islands is surrounded by a chain of secondary islands. We will see that the types of orbits are inexhaustible, if we look closely enough. The chaotic trajectory (figure 3.17) lives in the chaotic sea. Thus the section provides a summary of the types of motion possible and how they are related to one another. It is much more useful than plots of a zillion trajectories.
The section for a particular energy summarizes the dynamics at that energy. A sequence of sections for various energies shows how the major features change with the energy. We have already noticed that at low energy the section is dominated by regular orbits, at intermediate energy the section is divided more or less equally into regular and chaotic regions, and at high energies the section is dominated by a single chaotic zone. We will see that such transitions from regular to chaotic behavior are quite common; similar phenomena occur in widely different systems, though the details naturally depend on the system under study.
The following procedure is an implementation of the Poincaré map for the Hénon-Heiles system:
(define (HHmap E)
(let ((advancer
(state-advancer
(phase-space-derivative HHHam))))
(lambda (y py cont fail)
(define (find-next-crossing s)
(let lp ((s s))
(let ((ns (advancer s .1 1.e-12)))
(if (and (> (ref (coordinate ns) 0) 0)
(< (ref (coordinate s) 0) 0))
(refine-crossing s)
(lp ns)))))
(define (refine-crossing s)
(let ((dt (- (/ (ref (coordinate s) 0)
(ref (momentum s) 0)))))
(let ((ns (advancer s dt 1.e-12)))
(if (< (abs (ref (coordinate s) 0))
1.e-10)
;; return new section point
(cont (ref (coordinate ns) 1)
(ref (momentum ns) 1))
;; continue refining
(refine-crossing ns)))))
(let ((initial-state (section->state E y py)))
(if (not initial-state)
(fail)
(find-next-crossing initial-state))))))
The system derivative is computed directly as the phase-space derivative of the Hamiltonian. The Hamiltonian procedure for the Hénon-Heiles problem is
(define (HHHam s)
(+ (* 1/2 (square (momentum s)))
(HHpotential s)))
with the potential energy
(define (HHpotential s)
(let ((x (ref (coordinate s) 0))
(y (ref (coordinate s) 1)))
(+ (* 1/2 (+ (square x) (square y)))
(- (* (square x) y) (* 1/3 (cube y))))))
For each initial point (y, py) on the surface of section, the map first finds the initial state that has the specified energy, if one exists. The procedure section->state handles this task:
(define (section->state E y py)
(let ((d (- E (+ (HHpotential (up 0 (up 0 y)))
(* 1/2 (square py))))))
(if (>= d 0.)
(let ((px (sqrt (* 2 d))))
(up 0 (up 0 y) (down px py)))
#f)))
The procedure section->state returns #f (false) if there is no state consistent with the specified energy.
The initial state is then advanced by the internal procedure find-next-crossing until successive states are on opposite sides of the section plane. After finding states that straddle the section plane the crossing is refined by Newton's method, as implemented by the internal procedure refine-crossing.
To explore the Hénon-Heiles map we use explore-map as before:
(define win (frame -.5 .7 -.6 .6))
(explore-map win (HHmap 0.125) 500)
We have seen that the motion of an axisymmetric top can be essentially
solved. A plot of the rate of change of the tilt angle versus the
tilt angle is a simple closed curve. The evolution of the other
angles describing the configuration can be obtained by quadrature once
the tilting motion has been solved. Now let's consider a
non-axisymmetric top. A non-axisymmetric top is a top with three
unequal moments of inertia. The pivot is not at the center of mass, so
uniform gravity exerts a torque. We assume the line between the pivot
and the center of mass is one of the principal axes, which we take to
be  . There are no torques about the vertical axis, so the
vertical component of the angular momentum is conserved. If we write
the Hamiltonian in terms of the Euler angles, the angle
  ,
which corresponds to rotation about the vertical, does not appear.
Thus the momentum conjugate to this angle is conserved. The
nontrivial degrees of freedom are
  and
and  , with their
conjugate momenta.
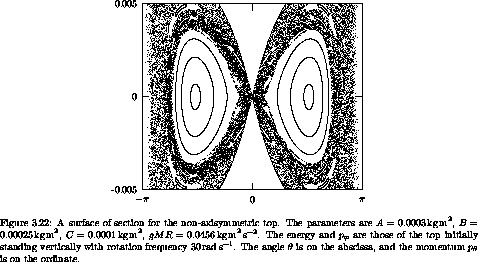
We can make a surface of section (see figure 3.22) for
this problem by displaying p versus
  when
when  = 0.
There are in general two values of p
 possible for given values
of energy and p
 . We plot points only if the value of
p
 at the crossing is the larger of the two possibilities. This
makes the points of the section correspond uniquely to a trajectory.
In this section there is a large quasiperiodic island surrounding a
fixed point that corresponds to the tilted equilibrium point of the awake
axisymmetric top (see figure 3.7 in
section 3.4). Surrounding this is
a large chaotic zone that extends from  = 0 to angles near
 . If this top is placed initially near the vertical, it exhibits
chaotic motion that carries it to large tilt angles. If the top is
started within the quasiperiodic island, the tilt is stable.
22 The surface of section technique was introduced by Poincaré in his Méthodes Nouvelles de la Mécanique Céleste [35]. Poincaré proved remarkable results about dynamical systems using the surface of section technique, and we shall return to these later. The surface of section technique is a key tool in the modern study of dynamical systems, for both analytical and numerical investigations.
23 That solutions of ordinary differential equations can show exponential sensitivity to initial conditions was independently discovered by Edward Lorenz [31] in the context of a simplified model of convection in the Earth's atmosphere. Lorenz coined the picturesque term ``butterfly effect'' to describe this sensitivity: his weather system model is so sensitive to initial conditions that ``the flapping of a butterfly's wings in Brazil can change the course of a typhoon in Japan.''
24 We saw an example of this extreme sensitivity to initial conditions in figure 1.7 (section 1.7).
25 One-dimensional invariant sets with an infinite number of holes are sometimes called cantori, by analogy to the Cantor sets, but it really doesn't Mather.
26 In the particular case of the driven pendulum there is no reason to call fail. This contingency is reserved for systems where orbits escape or cease to satisfy some constraint.
27 We will see that it is convenient to look at distribution functions in the phase-space coordinates because the consequences of conserved momenta are more apparent, and also because volume in phase space is conserved by evolution (see section 3.8).
28 A system is ergodic if time averages along trajectories are the same as phase-space averages over the region explored by the trajectories.
29 As before, upon close examination we may find that trajectories that appear to be confined to a curve on the section are chaotic trajectories that explore a highly confined region. It is known, however, that some trajectories really are confined to curves on the section. Trajectories that start on these curves remain on these curves forever, and they fill these curves densely. These invariant curves are preserved by the dynamical evolution. There are also invariant subsets of curves with an infinite number of holes.